VMs are often used in Azure because sometimes higher-quality services such as Platform Services are not suitable. For each VM, there is basic monitoring such as network traffic and corresponding visualizations (e.g. under Metrics) directly in the portal.
Often, the question is which process is using how much RAM or how much CPU. For this purpose, the systems have corresponding performance counters that provide the relevant information. Log Analytics can be used to evaluate this well. It has a powerful and practical query language and can also visualize the data. However, the desired performance counters must be configured in Log Analytics so that they can be collected there.
What to watch?
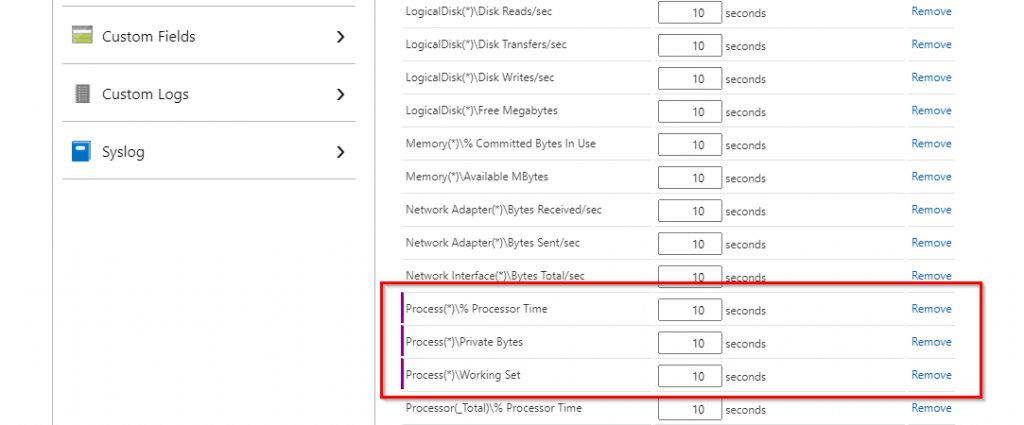
Basic performance counters for the entire system are supplied as standard, for example CPU utilization and memory consumption. Since we need the information for each individual process, we have to select the necessary performance counters for processes and add them to the log analytics. The page process objects describes all performance counters for processes. I especially recommend the following values:
Process(*)\% Processor Time: Shows the percentage of time that the processor spent executing this processProcess(*)\Working Set: Shows the size, in bytes, in the working set of this process. The working set is the set of memory pages that were touched recently by the threads in the process.Process(*)\Private Bytes: Shows the size, in bytes, that this process has allocated that cannot be shared with other processes.
Add to Log Analytics
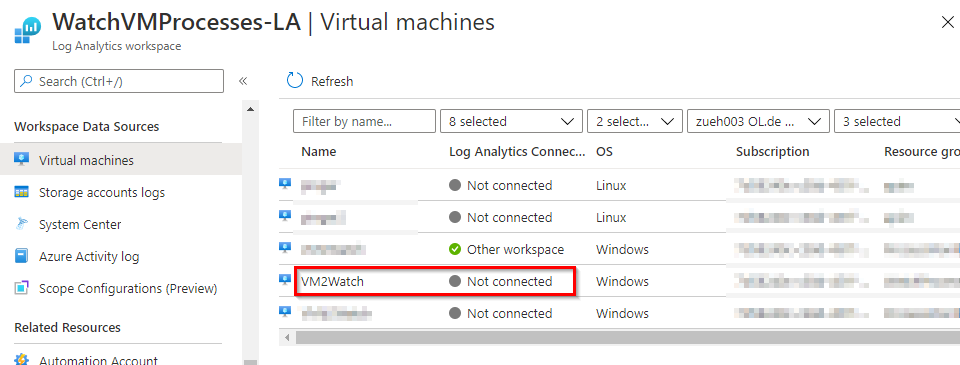
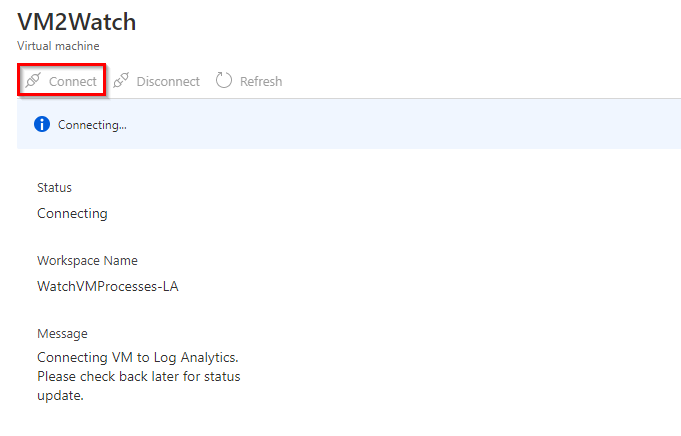
To tap the corresponding performance counter, the VM must be connected to the Log Analytics workspace. To do this, click on Virtual Machines in the Log Analytics Workspace under Workspace Data Sources. The VM to be monitored has the status Not connected. After clicking on the respective line, a connection between the two services can be established by clicking on Connect.
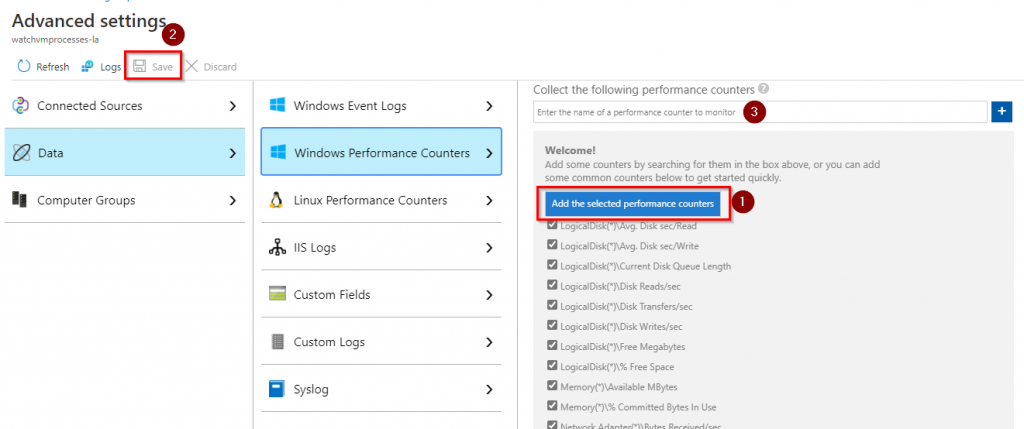
The respective performance counters can then be selected under Advanced Settings. After navigating under Data and the counters of the respective OS (I use Windows), the standard counters can be included in the monitoring with Add the selected performance counters (1) and then Save (2). Our required process counters are missing from the list. These can be found and added individually by entering the exact description in the search field (3).
Generate CPU Usage
To demonstrate process monitoring, I use a modification of the Fibunacci sequence. My variant contains another calculation element, which quickly results in a heavy CPU load:
𝑓n = 𝑓n-1 + 𝑓n-2 – 𝑓n-3
But it also has the advantage that the input value is the same as the output value, i.e. 𝑓(24) is 24. Therefore, the correctness is easy to check and there are no large numbers that can cause memory overflows. In PowerShell, the recursive implementation can be found in line 1-4:
function ConsumeCPU($n){
    if($n -le 2){ return $n }
    return (ConsumeCPU($n-1)) + (ConsumeCPU($n-2)) - (ConsumeCPU($n-3))
}

for($i=1;$i -le 10;$i++)
{
    $start = Get-Date
    $res = ConsumeCPU 24
    $end = Get-Date
    $diff = $end - $start
    Write-Output "run $i calculates $res in $($diff.TotalSeconds) seconds"
}
To create some load, I calculate the value of 24 (which takes about 80 seconds) and do the whole calculation 10 times (line 6-13).
Analyse Process Values
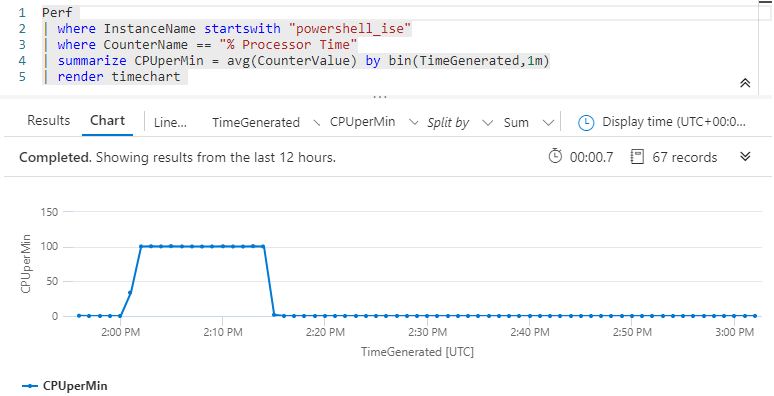
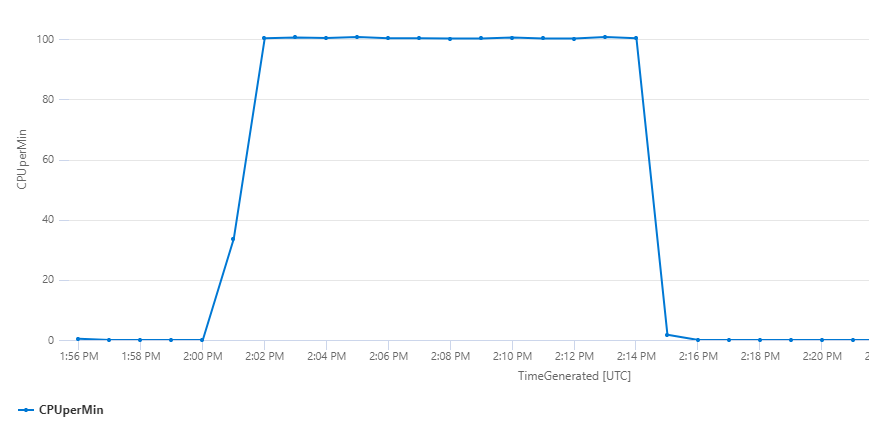
The query language of Log Analytics can now be used to determine the respective counter of the process. The values of the performance counter are saved in the table Perf. Each performance counter can be found there under CounterName and its value under CounterValue. In my example, the CPU time used by the process was particularly relevant. I filtered for powershell_ise (I ran the script there) and the counter for % Processor Time.
Perf
| where InstanceName startswith "powershell_ise"
| where CounterName == "% Processor Time"
| summarize CPUperMin = avg(CounterValue) by bin(TimeGenerated,1m)
| render timechart
The result calculates the average of the CPU utilization (this is logged every 10 seconds) per minute (TimeGenerated, 1m). The result is rendered as a time chart and shows the high utilization of the CPU at the time of the 10 loop runs:
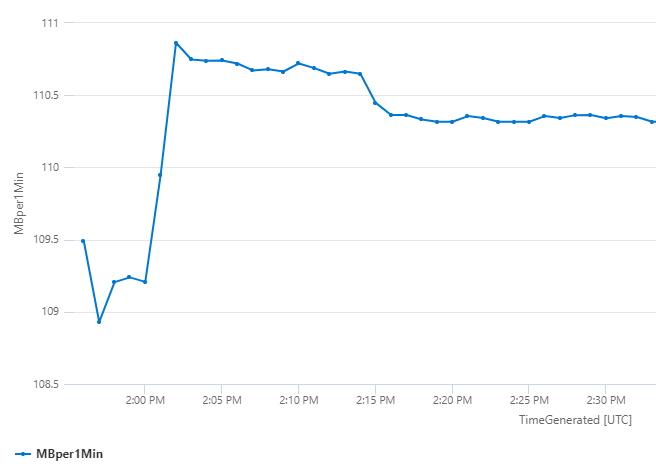
If the RAM usage is required, the query is quite similar. Since the counter supplies bytes here, a conversion into megabytes is worthwhile. Therefore a new column is introduced in line 4:
Perf
| where InstanceName startswith "powershell_ise"
| where CounterName == "Private Bytes"
| extend PrivateMByte = (CounterValue / 1048576)
| summarize MBper1Min = avg(PrivateMByte) by bin(TimeGenerated,1m)
| render timechart
The result is also rendered as a graph:
Schreibe einen Kommentar