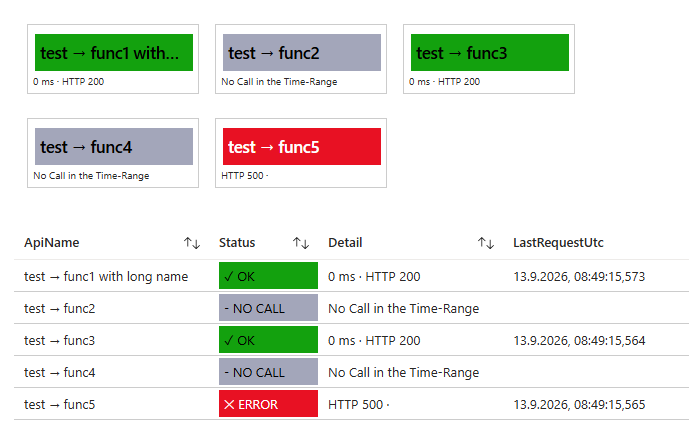
Azure API Management offers many features to support API development and maintenance. Monitoring APIs is a common use case; for this purpose, APIM includes an Analytics blade. It provides a clear overview of API calls and aggregates responses based on success, failure, and response times.
However, the result of the last call is often what is desired. It is also crucial to know whether that last call occurred recently or several days ago. To obtain this information, API calls can be exported to a Log Analytics workspace and visualized using a workbook.
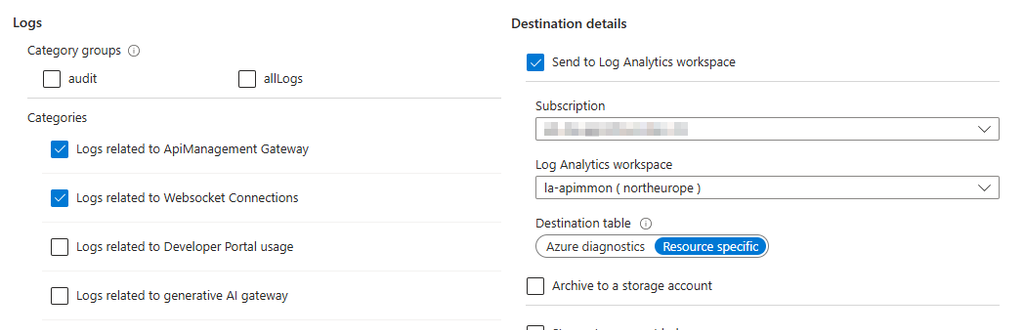
To export API calls, you can enable the export of ApiManagement Gateway and Websocket Connections in the diagnostic settings. This creates and populates the ApiManagementGatewayLogs table in the Log Analytics workspace.
Next, a workbook can be set up, and the selected Log Analytics workspace can be chosen as the data source. If multiple queries use the same time range, a parameter block is a suitable approach. In this case, the parameter is names TimeRange. The following query uses the specified time range parameter to retrieve the most recent call within that period. The results are labeled as OK, ERROR, or NO CALL and include additional details.
let endpoints = datatable(
    ApiName:string,
    EndpointPath:string,
    HttpMethod:string,
    ExpectedStatus:int
)
[
    "test → func1 with long name", "/api/test/func1", "GET",  200,
    "test → func2", "/api/test/func2", "GET",  200,
    "test → func3", "/api/test/func3", "POST", 200,
    "test → func4", "/api/test/func4", "POST", 200,
    "test → func5", "/api/test/func5", "GET",  200
]
| extend
    EndpointPath = tolower(EndpointPath),
    HttpMethod = toupper(HttpMethod);

endpoints
| join kind=leftouter (
    ApiManagementGatewayLogs
    | where TimeGenerated {TimeRange}
    | extend
        EndpointPath = tolower(tostring(parse_url(Url).Path)),
        HttpMethod = toupper(tostring(Method))
    | summarize arg_max(TimeGenerated, *) by EndpointPath, HttpMethod
) on EndpointPath, HttpMethod
| extend Status = case(
    isnull(TimeGenerated), "NO CALL",
    toint(ResponseCode) == ExpectedStatus and IsRequestSuccess == true, "OK",
    "ERROR"
)
| extend Detail = case(
    Status == "NO CALL", "No Call in the Time-Range",
    Status == "OK", strcat(tostring(toint(round(todouble(TotalTime), 0)))," ms · HTTP ",tostring(ResponseCode)),
    strcat("HTTP ",tostring(ResponseCode)," · ",tostring(LastErrorMessage))
)
| project
    ApiName,
    Status,
    Detail,
    LastRequestUtc = TimeGenerated
| order by ApiName asc
Lines 8 through 12 define the APIs to be checked. This involves specifying a display name, the API URL, the HTTP method, and the expected response code.
In lines 19 and 20, this list is joined with the ApiManagementGatewayLogs table using the method name and the URL path.
Lines 27–30 determine the Status. If the TimeGenerated column is empty following the left outer join, it indicates that no API call occurred, and the status is set to NO CALL. If the response code matches the expected value, the status is OK; otherwise, it is set to ERROR.
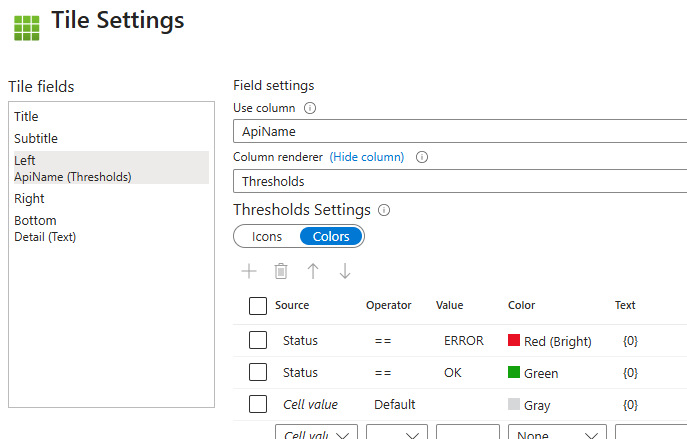
Subsequently, the same query can be used for different visualizations. The upper section displays the APIs as tiles, while the lower section displays them as a grid. For the tile configuration, the ApiName is displayed in the center (tile field Left). However, the column type is set to Thresholds with the color value based on the Status. The text value is set to {0} to outputs the content of ApiName.
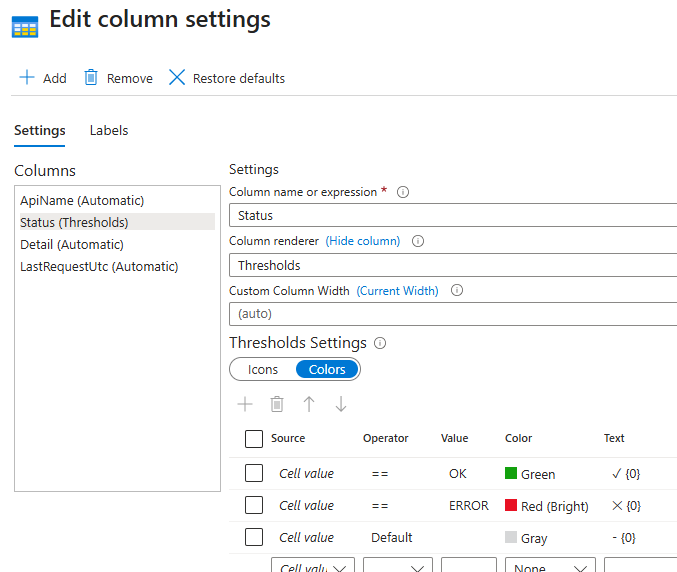
For the grid configuration, the Status column can also be color-coded. To do this, select Thresholds as the column type and set the color value based on the Cell value.
The combination of KQL and visualizations in Azure Workbooks is excellent for displaying dashboards and meeting even demanding requirements.
Schreibe einen Kommentar